Statement
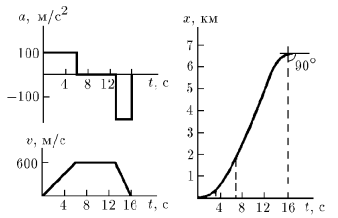
1.2.15. The acceleration of the rocket cart from start to stop for the first 6 seconds is 100 m/s
Solution

On the time interval from 0 s and up to 6 s, a cart moves equidistantly with constant acceleration
This is the equation of an increasing straight line.
During the interval from 6 s to 13 s, the cart moves at a constant speed, which it acquired at 6 seconds, which will be the maximum speed of the cart:
On the time interval from 13 s and up to 16 s the cart moves equidistantly with constant acceleration
This is the equation of a decreasing straight line. I note that here time
The path traveled by the cart in the interval from 0 s to 6 s has the following functional dependence:
It is a parabola with a branch pointing upward. At this acceleration interval, the cart has traveled the distance:
On the section with constant velocity 600 m/s (from 6 s to 13 s), the functional dependence of the path on time is an increasing straight line:
I also note that here
The path traveled by the cart on the interval from 13 s to 16 s has the following functional dependence:
It is a parabola with a branch pointing downward. The time varies between 0 and 3. In this braking section, the cart has traveled a distance:
Total path:
The area under the acceleration graph has a mathematical meaning of velocity, so in order to be sure that the cart has stopped it is necessary to check the equality of areas on the acceleration graph above and below the
Answer
See figure;