| @@ -1,8 +1,9 @@ |
| ### Statement |
| ### Statement |
| |
| |
| $1.2.16.$ |
| $1.2.16.$ |
| |
|  |
| The graphs of the coordinate dependence on time is plotted for two particles using two different time |
| The graphs of the coordinate dependence on time is plotted for two particles using two different time |
| scales. The plotted graphs turn out to be the same. One division of the time axis |
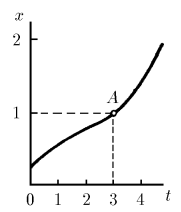
| scales. The plotted graphs turn out to be the same (Figure 1). One division of the time axis |
| $t$ for the graph of the first particle corresponds to $4 \text{s}$, and for the graph of the |
| $t$ for the graph of the first particle corresponds to $4 \text{s}$, and for the graph of the |
| second particle is $1 \text{s}$. Find the ratio of velocities and the ratio of particle accelerations |
| second particle is $1 \text{s}$. Find the ratio of velocities and the ratio of particle accelerations |
| for point A of the graph. |
| for point A of the graph. |
| | | |
| ### Solution | | ### Solution |
| We know the instantaneous velocity and acceleration of any object at a given point can be extracted from a plot using | | We know the instantaneous velocity and acceleration of any object at a given point can be extracted from a plot using |
| \begin{align*} | | \begin{align*} |
| v &= \lim_{\Delta t \to 0} \frac{\Delta x}{\Delta t} = \frac{d x}{d t} | | v &= \lim_{\Delta t \to 0} \frac{\Delta x}{\Delta t} = \frac{d x}{d t} |
| \end{align*} | | \end{align*} |
| \begin{align*} | | \begin{align*} |
| a &= \lim_{\Delta t \to 0} \frac{\Delta v}{\Delta t} =\frac{d v }{d t} | | a &= \lim_{\Delta t \to 0} \frac{\Delta v}{\Delta t} =\frac{d v }{d t} |
| \end{align*} | | \end{align*} |
| We note that, for any given time, the graphs exactly coincide, so any $\Delta x$ is exactly the same for both particles, and so $dx_1 = dx_2$. Likewise, for any time interval, we know that $\Delta t_1 = 4 \Delta t_2$, so $dt_1 = 4dt_2$. We can then say, for an equivalent Point A on their graphs, that: | | We note that, for any given time, the graphs exactly coincide, so any $\Delta x$ is exactly the same for both particles, and so $dx_1 = dx_2$. Likewise, for any time interval, we know that $\Delta t_1 = 4 \Delta t_2$, so $dt_1 = 4dt_2$. We can then say, for an equivalent Point A on their graphs, that: |
| \begin{align*} | | \begin{align*} |
| v_1 &=\frac{d x_1}{d t_1} = \frac{d x_2}{4 d t_2} = \frac{1}{4} \left( \frac{d x_2}{d t_2} \right) = \frac{1}{4} v_2 | | v_1 &=\frac{d x_1}{d t_1} = \frac{d x_2}{4 d t_2} = \frac{1}{4} \left( \frac{d x_2}{d t_2} \right) = \frac{1}{4} v_2 |
| \end{align*} | | \end{align*} |
| Using the same logic, we can then say for the accelerations that: | | Using the same logic, we can then say for the accelerations that: |
| \begin{align*} | | \begin{align*} |
| a_1 &= \frac{d v_1 }{d t_1} = \frac{d \left( \frac{1}{4} v_2 \right)}{4 d t_2} = \frac{1}{16} \left( \frac{d v_2}{d t_2} \right) = \frac{1}{16} a_2 | | a_1 &= \frac{d v_1 }{d t_1} = \frac{d \left( \frac{1}{4} v_2 \right)}{4 d t_2} = \frac{1}{16} \left( \frac{d v_2}{d t_2} \right) = \frac{1}{16} a_2 |
| \end{align*} | | \end{align*} |
| More generally, we can say that, if the time scale divisions are related by $\Delta t_1 / \Delta t_2 = \alpha$, the ratio of velocities are given by: | | More generally, we can say that, if the time scale divisions are related by $\Delta t_1 / \Delta t_2 = \alpha$, the ratio of velocities are given by: |
| \begin{align*} | | \begin{align*} |
| \frac{v_2}{v_1} = \alpha | | \frac{v_2}{v_1} = \alpha |
| \end{align*} | | \end{align*} |
| and the ratio of accelerations is given by: | | and the ratio of accelerations is given by: |
| \begin{align*} | | \begin{align*} |
| \frac{a_2}{a_1} = \alpha^2 | | \frac{a_2}{a_1} = \alpha^2 |
| \end{align*} | | \end{align*} |
| | | |
| | | |
| #### Answer | | #### Answer |
| | | |
| The ratio of velocities is | | The ratio of velocities is |
| \begin{align} | | \begin{align} |
| \boxed{ | | \boxed{ |
| \frac{v_2}{v_1} = 4 | | \frac{v_2}{v_1} = 4 |
| } | | } |
| \end{align} | | \end{align} |
| And the ratio of the acceleration is | | And the ratio of the acceleration is |
| \begin{align} | | \begin{align} |
| \boxed{ | | \boxed{ |
| \frac{a_2}{a_1} = 4^2 = 16 | | \frac{a_2}{a_1} = 4^2 = 16 |
| } | | } |
| \end{align} | | \end{align} |
