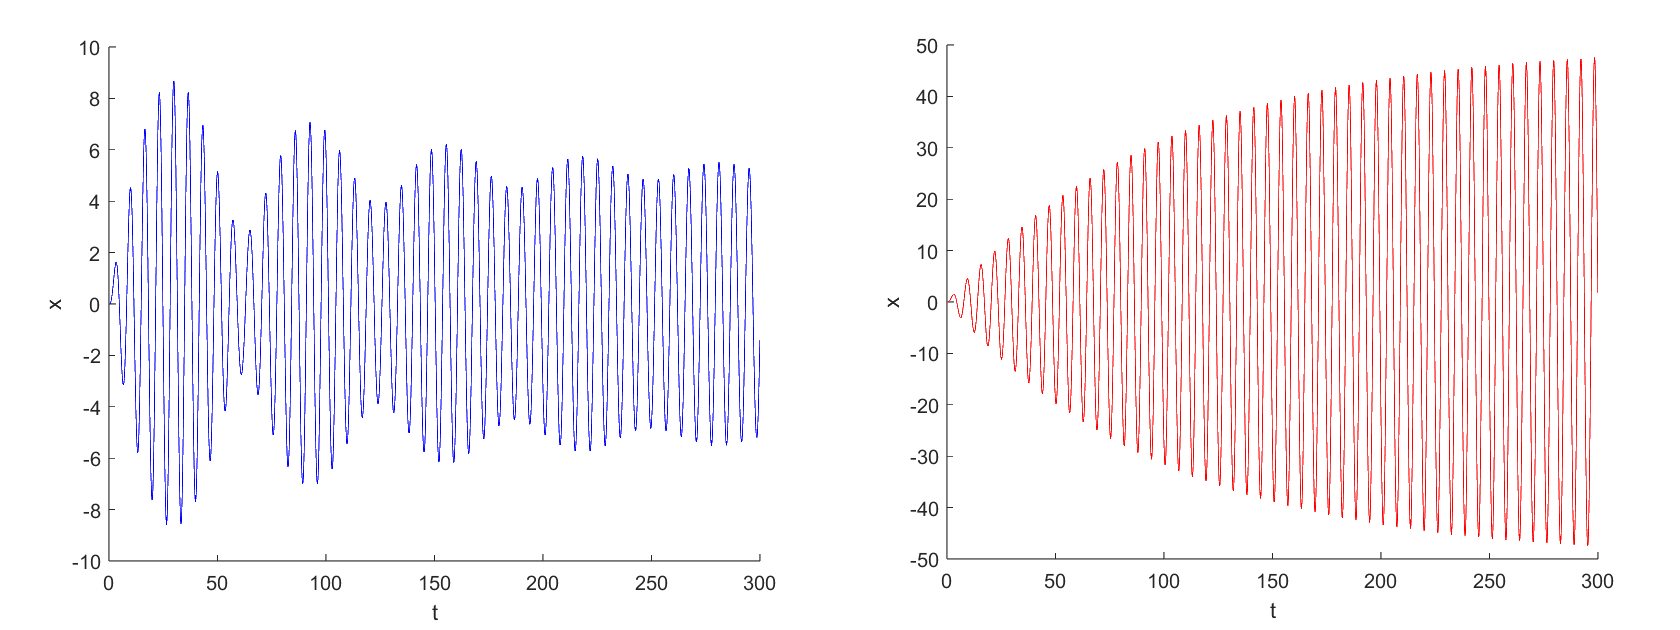
The graphs are produced with parameters $\omega_0=1$ s$^{-1}$,$\gamma=0.01$ s$^{-1}$,$F_0/m=1$ m/s$^2$, where $F_0$ is the amplitude of external forcing.
Since the oscillator starts from rest, the magnitude of free oscillation is initially comparable to that of forced oscillation. Also, weak damping may be ignored for the first few periods. When $|\omega-\omega_0|\gg\gamma$ (in the blue graph $\omega=0.9$), beats with period $2\pi/|\omega-\omega_0|\approx63$ s appear initially. However, as soon as the effect of damping becomes significant, free oscillation diminishes, and forced oscillation is established. When $\omega=\omega_0$ (in the red graph), we may consider the beat as having an extremely long period. Similarly, as soon as the effect of damping becomes significant, free oscillation diminishes, and forced oscillation is established. The characteristic time scale for exponential decay of free oscillation is $1/\gamma=100$ s, but it takes about $3\gamma=300$ s for free oscillation to becomes less than 5% of its initial value, and forced oscillation is firmly established.