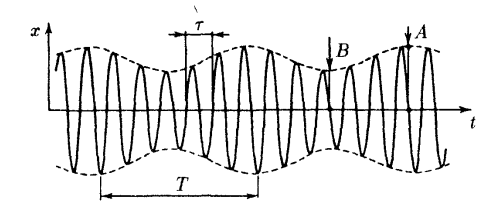
3.4.19. The graph of coordinate versus time for a motion that is the sum of two harmonic oscillations is shown in the figure. Use it to determine the amplitudes and frequencies of these oscillations.
For problem $3.4.19$
Solution
1. Extracting Amplitudes from the Graphical Envelope The given graph illustrates a classic beating phenomenon resulting from the linear superposition of two harmonic oscillations with nearly equal amplitudes and slightly different frequencies ($\omega_1\approx\omega_2$). The general equation describing the displacement $x(t)$ of such a combined system is: $$x(t)=a_1\sin(\omega_1t)+a_2\sin(\omega_2t)$$
Looking closely at the graph parameters: — Maximum Envelope Peak ($A$): This occurs when the two individual oscillations interfere constructively: $$A_{\max}=a_1+a_2=A$$ — Minimum Envelope Neck ($B$): This occurs when the two components interfere destructively, opposing each other: $$A_{\min}=|a_1-a_2|=B$$
We can solve this simple algebraic system to isolate the distinct amplitudes $a_1$ and $a_2$ (assuming $a_1>a_2$): $$a_1=\frac{A+B}{2}, \quad a_2=\frac{A-B}{2}$$
2. Extracting Frequencies from the Graphical Periods The graph defines two specific time intervals on the horizontal axis: — $\tau$(Period of Fast Oscillations): This corresponds to the time it takes to complete one full cycle of the rapid inner wave. It is directly tied to the average carrier frequency: $$\tau=\frac{2\pi}{\omega_{\text{avg}}}=\frac{4\pi}{\omega_1+\omega_2}$$
— $T$(Beat Period): This represents the time interval between two consecutive minimums (necks) of the slow amplitude envelope. The beat frequency is related to the difference between the two frequencies: $$T=\frac{2\pi}{\omega_{\text{beat}}}=\frac{2\pi}{|\omega_1-\omega_2|}$$
3. Mathematical Combination to Isolate $\omega_1$ and $\omega_2$ From our period relations, we can construct expressions for the sum and difference of the target frequencies: $$\omega_1+\omega_2=\frac{4\pi}{\tau}$$ $$\omega_1-\omega_2=\frac{2\pi}{T}$$
To isolate $\omega_1$, we add the two equations and divide by 2: $$2\omega_1=\frac{4\pi}{\tau}+\frac{2\pi}{T} \implies \omega_1=\pi\left(\frac{2}{\tau}+\frac{1}{T}\right)$$
To isolate $\omega_2$, we subtract the second equation from the first and divide by 2: $$2\omega_2=\frac{4\pi}{\tau}-\frac{2\pi}{T} \implies \omega_2=\pi\left(\frac{2}{\tau}-\frac{1}{T}\right)$$
Converting to cyclical frequency $f=\frac{\omega}{2\pi}$ yields: $$f_1=\frac{1}{\tau}+\frac{1}{2T}, \quad f_2=\frac{1}{\tau}-\frac{1}{2T}$$