Правка разделов «Statement», «Solution»

en/1.2.17.md
+5 −5
| @@ -1,14 +1,14 @@ | |||
| ### Statement | |||
| − | $1.2.17.$ | ||
| + | $1.2.17.$ | ||
| + | 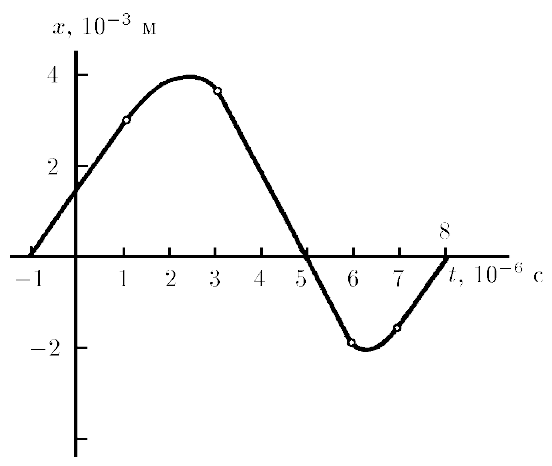 | ||
| + | The part of the coordinate-time dependence graph located below the t-axis is similar to the part of the graph that is above this axis (see Figure). Plot graphs based on time, speed, and acceleration. Compare the accelerations for the largest and smallest values of x. | ||
| + | |||
| ### Solution | |||
| − | The part of the coordinate-time dependence graph located below the t-axis is | ||
| − | similar to the part of the graph that is above this axis. Plot graphs based on | ||
| − | time, speed, and acceleration. Compare the accelerations for the largest and | ||
| − | smallest values of x. | ||
| + | |||
| #### Answer | |||
| [Insert a concise answer or boxed result] | |||
| @@ -1,14 +1,14 @@ | |||
| ### Statement | ### Statement | ||
| $1.2.17.$ |
$1.2.17.$ | ||
|  | |||
| The part of the coordinate-time dependence graph located below the t-axis is similar to the part of the graph that is above this axis (see Figure). Plot graphs based on time, speed, and acceleration. Compare the accelerations for the largest and smallest values of x. | |||
| ### Solution | ### Solution | ||
| The part of the coordinate-time dependence graph located below the t-axis is | |||
| similar to the part of the graph that is above this axis. Plot graphs based on | |||
| time, speed, and acceleration. Compare the accelerations for the largest and | |||
| smallest values of x. | |||
| #### Answer | #### Answer | ||
| [Insert a concise answer or boxed result] | [Insert a concise answer or boxed result] | ||