Statement
$3.5.1.$ A pendulum of mass $m$ is subjected to short shocks, for each of which it receives an impulse $p_0$. Construct a graph of the pendulum motion if it is known that at the beginning it was at rest, that there is no damping of oscillations, and the shocks follow each other at time intervals $T_0$ and $T_0/2$ ($T_0$ is the period of free oscillations of the pendulum).
Solution
When the shocks follow each other at time intervals $T_0$, each following shock encrease the momentum of the pendulum by
$$
p_0,
$$
thus for a increments of the maximum velocity and the maximum displacement after each shock we can write:
$$
\Delta v_\text{max}=p_0/m,\quad \Delta x_\text{max}=p_0/(m\omega).
$$
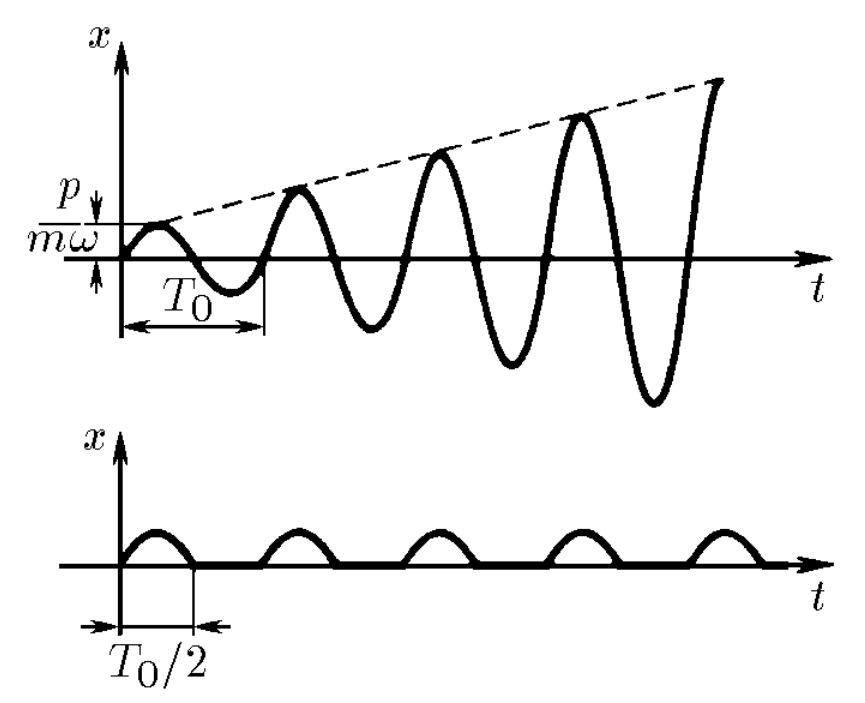
So the graph of the pendulum motion is a set of sinusoidal parts with amplitudes $p_0/(m\omega), 2p_0/(m\omega), \ldots$
When the shocks follow each other at time intervals $T_0/2$, after each even shock the pendulum momentum becomes zero, thus after each odd shock we have the same motion with amplitude $p_0/(m\omega)$. So we obtain a set of identical half-waves on the graph of the pendulum motion.
Answer
Discussion
Log in to join the discussion